Introducing VEP-bench: predicting variant effects with language models
VEP-bench v0.1
Early draft: This post was generated by an AI agent and has not yet been reviewed by the authors. We’re sharing it to invite early feedback; it may contain errors or overstate conclusions. We plan to replace it with an author-written version.
Can general-purpose language models predict the effects of genetic variants from DNA sequence and experimental context? VEP-bench tests this directly, without tools or internet access.
The first release covers fitness, gene expression, and splicing across 52 experimental panels and 2,600 variant appearances. Performance varies across these tasks, providing a view of model capabilities that an overall score alone cannot capture.
Dataset
Prediction tasks and questions
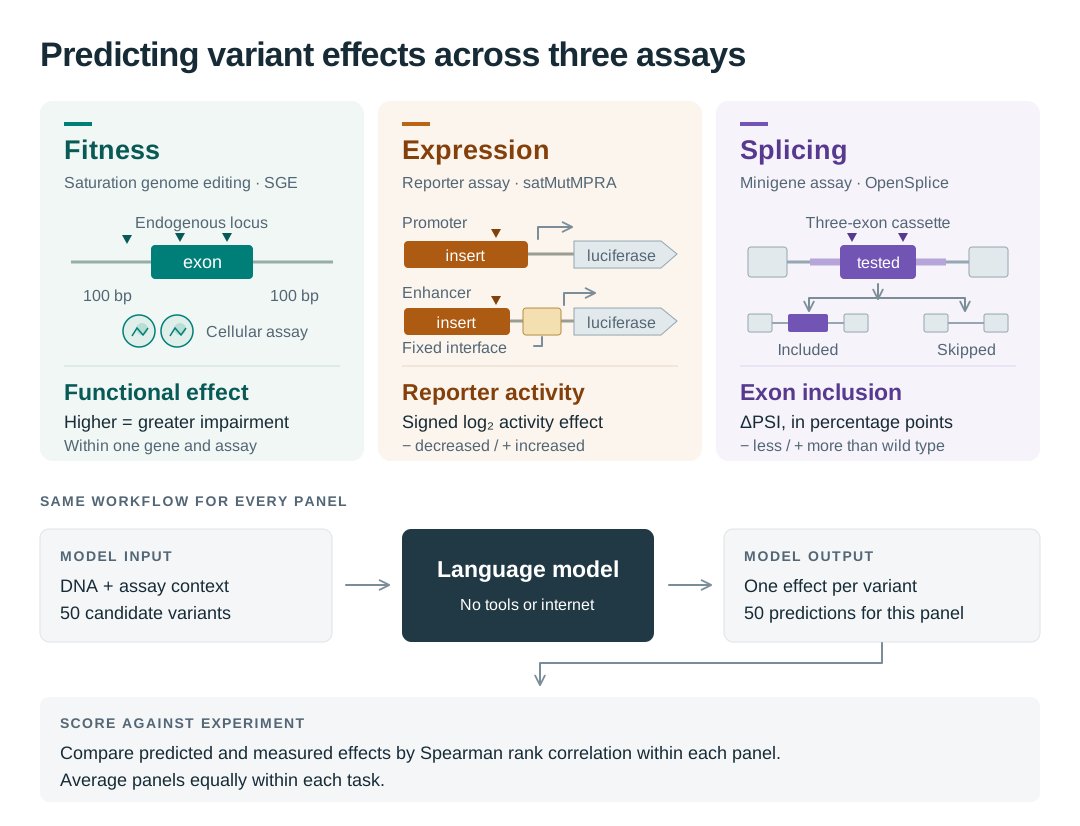
The three tasks measure different outcomes: functional effects in saturation genome editing (SGE), reporter activity in satMutMPRA, and exon inclusion in OpenSplice.
Each question supplies sequence and assay context for a panel of 50 variants. Models predict an effect for every variant. We score the predicted ordering against the measurements using Spearman correlation within each panel, then average panels equally within each task. The overall score is the equally weighted mean of the three task scores.
Example prompt: MSH6 exon 7
This is the complete prompt for MSH6 exon 7, the panel selected for our later response case study. The gene name identifies the example for readers; it is not included in the model's prompt.
Explore this question and model responses.
Dataset composition
Counts describe the selected benchmark panels. Each variant is counted once per panel; an allele appearing in two panels contributes twice.
Variant type distribution
We classify the complete REF-to-ALT edit after trimming shared flanking bases. An SNV substitutes one base; an indel changes sequence length, including unequal-length replacements; a multibase substitution replaces multiple bases without changing length. Each variant belongs to one category.
Each task panel has its own automatically scaled percentage axis; compare the percentage labels across tasks. Hover over a bar for its count and denominator; zero labels indicate absent categories. On narrow screens, scroll horizontally to compare all three tasks.
Genomic consequence distribution
For each complete allele, we use the saved Ensembl VEP
most_severe_consequence: one highest-priority category per allele across the
returned transcript and regulatory-feature annotations. Transcript consequences
can differ between transcripts. The retained category is not an experimental
measurement or a clinical interpretation.
See Ensembl's consequence definitions and severity ordering.
Consequence rows are alphabetical and aligned across the three tasks. All observed categories are retained, including rare consequences.
The assay determines the prediction target. A variant labeled “missense” in its genomic context can still be evaluated for its effect on exon inclusion in a splicing reporter. Likewise, an intronic genomic annotation does not establish what a sequence will do in an expression reporter. These differences in composition provide context for model comparisons across tasks; they do not by themselves explain performance differences. The consequence annotations shown here are not supplied to the models.
Why are there so few intergenic variants in expression?
Our satMutMPRA subset contains nine promoter panels and seven enhancer panels, selected from the source study's targeted regulatory-element assays. Promoter sequences can receive upstream, UTR, or overlapping-transcript labels. Enhancers can also lie within genes: in this snapshot, every selected variant in the IRF4, TCF7L2, ZFAND3, and ZRS enhancer panels is labeled intronic. The MYC enhancer panel is labeled noncoding-transcript exon, and the SORT1 enhancer panel is labeled 3′ UTR. These names describe the assayed elements; VEP considers all annotated transcripts, including transcripts of other genes.
What does “regulatory region” mean here?
regulatory_region_variant denotes overlap with a regulatory-feature interval
in the saved Ensembl annotation. Ensembl identifies features such as promoters,
enhancers, and CTCF-binding sites using genomic annotations and epigenomic
evidence, including chromatin accessibility and ChIP-seq measurements of histone
marks or protein binding. See Ensembl Regulation
for the annotation methods. The 1,000 bp setting reported above controls
upstream/downstream gene annotations; it does not define regulatory-region
boundaries.
This label does not establish that the variant changes regulatory activity or that the feature is active in the MPRA's cell line. The regulatory-region bar is not a count of all regulatory-feature overlaps: a variant that overlaps both a regulatory feature and a transcript can receive a higher-priority transcript consequence in this single-label view. “Regulatory” and “intronic,” for example, can describe different aspects of the same allele.
Composition counts and provenance
Panel sampling spreads selections across the experimental score range. It does not impose variant-type or consequence quotas, and these distributions should not be read as frequencies in human populations or in the full source assays. See the shared sampling protocol.
The metadata records each panel's source-record digest, complete genomic alleles, and VEP annotation provenance. The composition figures are recomputed from that bundled snapshot when the page loads.
Results
We evaluate nine models at their highest available reasoning effort, using complete runs from the September 18, 2026 snapshot. Effort selection does not depend on score. The publication note documents recovered responses and replacements; the published DeepSeek configuration includes selective token-limit retries.
This snapshot adds GPT-6 Astra at maximum effort, with 52 valid answers under a 128,000-token output cap. Its completed responses cost $37.54 and used 1,610,754 tokens, including input and generated output with reasoning. Three OpenSplice serving errors were retried with unchanged settings; their original attempts remain in provenance and are excluded from benchmark cost and token usage. None of Astra's retained responses reached the cap. The interrupted DeepSeek maximum-effort evaluation is documented on the leaderboard and is excluded from these comparisons.
The bar plot shows overall Spearman scores across all three tasks, displayed as percentages to match the leaderboard. GPT-6 Astra has the highest overall score (0.610), followed by Gemini 3.8 Flash (0.559) and GPT-5.6 Sol (0.558).
Performance across tasks
The radar plot compares fitness, expression, and splicing on the same 0–1 Spearman scale.
Astra max has the highest observed score on all three tasks. Its splicing score is close to Gemini's (0.773 versus 0.770). All nine models score highest on splicing and lowest on expression in this dataset.
View overall and task scores
Explore all models and reasoning efforts on the leaderboard.
Results by variant type
Scores are recomputed within eligible panels, with at least 10 variants per panel and five panels per task. Bars show 95% confidence intervals; see the subset analysis methods for coverage and interpretation.
In SGE, all nine selected configurations have higher mean Spearman correlation for SNVs than deletions. The SNV analysis includes 478 variants in 15 panels; the deletion analysis includes 170 variants in 10 panels. Differences can reflect the different panel composition as well as variant class. Insertions lack enough eligible panels to report a score.
In satMutMPRA, only SNVs clear both cutoffs. The 60 expression deletions are too dispersed: no panel has 10, so no deletion summary score is reported.
In OpenSplice, deletions have higher mean Spearman correlation than SNVs for all nine selected configurations. Both strata retain all 20 panels, with 590 deletions and 410 SNVs. This still compares different selected variants and effect distributions within those panels.
Results by functional consequence
Scores are recomputed within eligible panels, with at least 10 variants per panel and five panels per task. Bars show 95% confidence intervals; see the subset analysis methods for coverage and interpretation.
In SGE, missense variants and in-frame deletions clear both cutoffs. In satMutMPRA, the eligible consequences are 5′ UTR, intronic, and upstream-gene variants; each category covers a different selection of reporter panels. In OpenSplice, only in-frame deletions clear both cutoffs for this axis.
Missense clears the cutoffs only in SGE; synonymous and stop-gained groups do not clear them in any task.
These are exploratory observations about the selected panels and saved configurations. The coverage cutoffs do not remove differences in assay context, effect range, or panel composition, and these observations do not establish a general advantage for one variant class.
Subset analysis methods and coverage
Analysis snapshot: 18 September 2026. We reused the saved answers from nine models across 52 panels, selecting the highest available reasoning effort for each model: max for GPT-5.6 Luna, Terra, Sol, GPT-6 Astra, and Muse; high for Gemini; and low for GLM, DeepSeek, and Kimi K3. Selection uses complete runs and does not depend on score; ties at the same effort use the latest run. Before examining stratum performance, we fixed two coverage cutoffs: at least 10 variants within an original panel and at least 5 eligible panels within a task. These are pragmatic coverage requirements, not a claim of statistical significance.
The snapshot includes the published DeepSeek configuration with selective token-limit retries and the recovered maximum-effort runs. Recovery metadata distinguishes available original responses, retries, and replacements. Completed invalid answers, including Luna’s invalid SGE answer, retain zero scores.
Allele type and functional consequence are separate axes: an SNV can also be missense. For this finer allele breakdown, we trim shared REF/ALT flanks and distinguish SNVs, pure insertions, pure deletions, and other/complex edits. Other/complex includes multibase substitutions and unequal-length replacements. Unknown alleles and unknown or ambiguous consequences remain explicit categories. Consequences use the saved VEP release 114 annotation described above: the most severe consequence across all Ensembl transcripts and returned regulatory features, with no canonical-transcript selection. We do not infer missense from exon membership.
Each dot is the unweighted mean of Spearman correlations recomputed within the eligible original panels, using the same candidate IDs and panel membership for every configuration in that stratum. We recompute ranks within each subset; raw assay values are never pooled across panels. Invalid original full-panel answers retain their zero penalty, even when their missing IDs fall outside the subset. Average ranks handle ties, and constant reference or prediction vectors score zero under the existing scorer. Both figures show signed Spearman correlations, including negative values. There is no combined score across these task-specific strata.
Horizontal bars are 95% Student's t confidence intervals for the mean across eligible panels: mean ± t(0.975, n − 1) × s / √n, using the sample standard deviation of panel scores. The unit is a gene panel in SGE and OpenSplice, or a regulatory-element panel in satMutMPRA. These are approximate, exploratory intervals: panel scores are bounded, some groups contain only five panels, and panels can share assay conditions. They are conditional on the saved answers and do not measure variability across repeated model runs. The intervals are pointwise; their overlap does not test differences between models or classes. We retain the full bounds without clipping to −1 or 1. Constant panel scores leave the interval unestimated. See the interval methodology for assumptions and reproduction.
Each figure aligns categories across the three task subplots. Models appear in the overall VEP-bench Spearman ranking order from the same saved publication, highest first, in both the dots and the legend. Each task subplot has an automatically scaled correlation axis; compare the tick values across tasks. Categories appear when at least one task clears both cutoffs; other task/category combinations are marked as insufficient coverage. Hover over a dot for its model, score, interval, and counts. On narrow screens, scroll horizontally to compare the task columns.
Coverage and exclusions
Counts are panel appearances, as in the composition figures. A group can have eligible panels yet fail the five-panel cutoff; its counts remain visible but it receives no summary score. Excluded panels contain fewer than 10 supported variants of that class, including panels with none. Missing or stale source-linked consequences are retained as unknown.
These variant-stratum figures and the AlphaGenome/AVI comparison use the same frozen LLM publication. The specialist comparison has a separate coverage plan: it compares complete eligible panels and does not apply these variant-class cutoffs.
The performance figures read only the bundled snapshot, never the live leaderboard. It retains annotation provenance, question and input-artifact hashes, evaluated model settings, exact candidate membership, per-panel scores, invalid-answer counts, and the model-family color mapping. The reproduction instructions describe the saved coverage plan and offline scoring command. This draft snapshot will accompany the dated analysis and immutable dataset release tracked in issue #79; it does not change the full benchmark leaderboard.
Exact scores and invalid-answer counts
Comparison with specialist models
We compare AlphaGenome's signed molecular predictions for splicing and expression, and AlphaGenome Variant Impact (AVI) scores for fitness, with saved LLM answers on the same variants within each original panel. Each panel has equal weight. The full benchmark leaderboard retains its original variant set.
Coverage is 1,000/1,000 splicing variants, 800/800 expression variants, and 487/800 fitness variants. The molecular predictions include indels; the AVI fitness comparison covers SNVs only. Each LLM is rescored on the same covered variants as the specialist.
Astra's fitness score is 0.611, compared with 0.586 for AVI, on the same 487 SNVs across 16 genes. Excluding AVI model-selection studies gives 0.589 versus 0.557 on 382 SNVs across 13 genes. These are higher observed scores on the matched SNV subsets; they do not establish an advantage on indels or statistically conclusive superiority.
Methodology and cell-type choices
Matched comparison. AlphaGenome/AVI and each LLM are evaluated on identical variants within each original panel, with equal weight per panel. LLM answers come from the frozen September 18 publication; rescoring makes no new LLM calls. Invalid original LLM answers retain their zero penalty, even if their missing variants fall outside the matched set.
Error bars and ordering. Bars show pointwise 95% Student's t confidence intervals for the equally weighted mean of panel correlations, using panels (genes, regulatory elements or exons) as the sampling units. These exploratory intervals assume independent panels and are conditional on the saved answers; they do not estimate shared assay effects or variability between model runs. They are not a paired significance test. Models are ordered by their mean matched Spearman score across the three equally weighted tasks. Each task's x-axis fits its own scores and intervals.
Splicing. We follow the OpenSplice native-context approach: a 16-kb window around the tested exon, averaging signed changes in canonical donor and acceptor probabilities. This measures a proxy for exon inclusion, not calibrated delta PSI. Complete indels are scored, including zero alternate probability when a canonical site is deleted.
Expression. Following AlphaGenome's zero-shot MPRA evaluation, we use
native genomic context and average signed DNase effects across matching
tracks as a proxy for reporter activity. The input is 1 Mb; the score is
log2((sum(ALT) + 1) / (sum(REF) + 1)) over 501 bp around the variant.
This uses the recommended API scorer with the published Enformer-setting
track matches, rather than the historical 512-bp scoring mask. Fourteen
elements use the mappings in
AlphaGenome Supplementary Table 10.
The two remaining mappings are our extensions, chosen from assay context
before scoring:
| Element | Assay context | Selected AlphaGenome DNase tracks |
|---|---|---|
| TCF7L2 | MIN6, also used for ZFAND3 | The same three pancreas tracks published for ZFAND3: endocrine-pancreas progenitor, body of pancreas, and pancreas |
| ZRSh13 | NIH3T3 with added HOXD13 | Nine human embryonic fibroblast tracks, including IMR-90 and eight skin-derived fibroblast tracks |
The original assay metadata supports the shared MIN6 mapping. The ZRSh13 mapping approximates the lineage and developmental stage of NIH3T3 embryonic fibroblasts, but does not reproduce HOXD13 overexpression. Both are human-track proxies for mouse cell-line assays. Tracks are weighted equally; none are selected using their correlation with benchmark answers, and no LASSO model is fitted.
Fitness and overlap. AVI measures general functional impact, rather than fitness in the specific assay conditions. The current public Atlas access covers the 487 selected fitness SNVs; the other 313 variants remain excluded. The second fitness comparison excludes BRCA1, RAD51C and DDX3X because their source studies were used for AVI model selection. CAGI5 MPRA was evaluated in the original AlphaGenome paper, and OpenSplice selected the 16-kb setting on its data, so these comparisons are not fully held out.
Free API access does not establish zero underlying inference cost, and Atlas lookup time does not measure the cost of generating its scores.
Scoring definitions, provenance and reproduction include the exact track ontology IDs, source evidence, coverage rules and departures from the original evaluations.
Comparison with other benchmarks
The plot below compares overall VEP-bench scores with the Artificial Analysis Intelligence Index v4.3.
Comparison methodology and sources.
Assay dates and model knowledge cutoffs
Correction — September 16, 2026. Our original 9 before / 7 after split used recent MaveDB releases without following their predecessors, other public repositories, or preprints. That overstated the number of later assays. The corrected split is 13 before / 2 after / 1 mixed, for all five models with known cutoffs in this snapshot. The figure, statistics and downloads below have been regenerated from the same frozen model outcomes using the corrected provenance. Model predictions and benchmark scores have not changed.
SGE's gene panels have different recorded public dates, so we can split them relative to each model's reported knowledge cutoff. The expression and splicing tasks each use a single assay date in this snapshot; they do not offer the same within-task split.
Each point below is the mean within-gene Spearman correlation, with equal weight per gene panel. Blue circles show panels before the cutoff; orange diamonds show panels after it. Counts are gene panels, not individual variants. Horizontal bars show 95% confidence intervals for each group mean. For each model we select its highest available reasoning effort among complete published SGE runs, breaking ties by the most recent run. Selection does not depend on performance. Models without a known cutoff are excluded.
The five cutoffs (February 16, March, and April 30, 2026) select the same genes. BARD1, CTCF, RAD51D and XRCC2 move to the earlier group. SFPQ is excluded from both means because its panel combines earlier and later evidence. The two remaining later panels are SBDS and TINF2; we verified no earlier scored release for either in this audit. This is a search result, not proof that they were absent from training data.
| Panel | Earlier public evidence for our 50 selected variants |
|---|---|
| BARD1 | MaveDB, October 21, 2025: all 50 scores identical. |
| CTCF | IGVF, November 18, 2025: all 50 scores identical; 31 variants had earlier scores in June. |
| PALB2 | IGVF, November 18, 2025: all 50 scores identical; replaces a citation to a different PALB2 assay. |
| RAD51D | IGVF, November 18, 2025: all 50 variants had scores, but all scores were subsequently revised. |
| XRCC2 | MaveDB, January 10, 2026: all 50 scores identical; 46 variants had scores in IGVF in November. |
| SFPQ | IGVF, June 23, 2025: 3 selected variants had earlier scores. The June 8, 2026 MaveDB release expands coverage to all 50. |
The audit also corrected older study dates using preprints and a BAP1 archived dataset. Individual IGVF file release dates determine availability: a file can be uploaded privately months before release, or added after its parent dataset became public.
The bars are symmetric 95% Student's t confidence intervals: mean ± t(0.975, n − 1) × s / √n, where s is the sample standard deviation of the gene-level scores in that date group. We compute them with SciPy's t distribution. The interval has exact 95% coverage at finite sample sizes when the gene scores are independent and identically normally distributed; it does not require a large-sample approximation under those assumptions. Normality is an approximation for these bounded correlation scores, so coverage here is approximate, especially with only two later panels. The intervals estimate uncertainty in the mean across genes, rather than variability across repeated model runs. We do not clip their bounds to the correlation range. A group with fewer than two genes or no variation has no estimated interval. Overlap between the two intervals is not the significance test; the p-value below tests the before-cutoff advantage directly.
The assay date records the earliest verified public scored-assay evidence covering the selected panel, including preprints, archived datasets and superseded releases. Earlier experimental scores qualify even if later revised; this comparison concerns prior assay evidence, not exact answer identity. For historical papers, study-level coverage is used and score identity across versions has not been established. A partial earlier release spanning the cutoff is Mixed availability and excluded from both means. These dates are evidence bounds, not demonstrated first indexing dates or proof of when a model saw data. For a cutoff specified only to the month, panels dated in that month are excluded because their ordering is unknown. An exact cutoff date includes that day in the “before” group. Missing or unmatched assay dates are also excluded.
A gap is descriptive, not a causal estimate of training-data exposure: the before and after groups contain different genes and experiments, with potentially different difficulty. Group membership can also change across models with different cutoffs. Completed format failures retain their published zero scores; negative correlations are retained. An empty group has no mean.
Does this model have a before-cutoff advantage?
The hypothesis is per model: does this model perform better on genes whose assays were available before its knowledge cutoff? We use SciPy's independent-sample permutation test with the statistic mean Spearman before minus mean Spearman after, a one-sided alternative (before greater than after), and exact enumeration. The gene panel is the independent unit. SciPy reassigns whole genes between the groups while keeping their sizes fixed; it counts allocations with a difference at least as large as observed. With 13 and 2 genes, all 105 allocations are included. This does not require normally distributed scores.
The test assumes independent genes whose scores are exchangeable between date groups under the null (the same score distribution). These genes and assays were not randomly assigned to publication dates, so the test describes an exploratory association. It cannot separate date from gene or assay differences. The reported p-values are unadjusted and interpreted separately for each model, with a per-model threshold of 0.05. A detected before-cutoff advantage would be consistent with source exposure, but would not prove overfitting. With only two later panels, a nonsignificant result cannot rule out overfitting or establish equivalence. Groups with fewer than two genes are not tested.
No model has a detected before-cutoff advantage at the per-model 0.05 threshold after this correction. The one-sided p-values are 0.781 for Luna, 0.695 for Terra, 0.429 for Sol, 0.619 for Astra, and 0.886 for Gemini. This small, uneven comparison provides little evidence about memorization; it should not be read as validation of a contamination-free evaluation.
Inspect the gene panels in each group
The cutoff analysis is a saved snapshot generated with SciPy from the published run and outcome indexes. Its CSV downloads retain run IDs, question-set digests, cutoffs, and assay-date sources for the displayed comparison.
Do explanations match the measured biology?
For supplementary case studies, we selected MSH6 exon 7 and the LDLR promoter before inspecting model explanations because the source papers describe their regulatory structures. We asked Astra Max for a substantive biological justification grounded in the supplied sequence, followed by predictions for the same 50 variants per panel. The prompt added no measured effects or paper annotations. This is a deliberately chosen pair of examples, and each explanation is the model's stated justification rather than a verified account of its internal reasoning.
For MSH6, Astra correctly located the splice signals and reconstructed sequence changes, but a plausible mechanism did not always predict the measured effect:
| Variant | Explanation prediction, ΔPSI | Measured ΔPSI | Interpretation |
|---|---|---|---|
| V41, G306A | −25 | −26.4 | Correctly distinguishes a weakened final exonic donor base from destruction of the intronic GT. |
| V19, G216A | −10 | −87.5 | Predicts rescue through a newly created, shifted acceptor; the measured loss is much larger. |
| V24, deletion 241–261 | −16 | +0.3 | Proposes loss of enhancer motifs, although this substantial interior deletion is tolerated. |
The V19 discrepancy also exposes a limitation in our question. Astra explicitly warned that its rescue prediction depends on whether shifted splice products count toward inclusion. The paper's Methods classify expected inclusion and skipping sequences by exact matching. Our prompt does not specify that counting rule. We therefore cannot attribute the mismatch solely to biological reasoning; defining the assay's measured target precisely matters alongside supplying the sequence.
This pattern extends across the panel: the 12 alleles overlapping the acceptor
average −86.4 measured ΔPSI, versus −18.2 predicted with explanation.
All 11 interior alleles are within 1.2 points of zero, despite predictions as
large as −16 or +8. Earlier branchpoint experiments
support the upstream TTCAT motif, with partial skipping after substitutions and
evidence compatible with alternative branchpoints. They do not validate the
model's specific enhancer and silencer assignments inside the exon. The
expanded MSH6 analysis
maps all 50 alleles, reconstructs the proposed rescue sites and mutant donors,
and distinguishes those earlier experiments from this reporter's measurements.
For LDLR, the established promoter architecture gives a more demanding test than recognizing isolated motifs. SatMutMPRA maps large activity losses to known regulatory elements, and GPN-Star Fig. 4D examines dependencies among regions labelled FP1, SREBP1, SREBP2, and SP1. The numbered labels refer to promoter repeats in the SatMutMPRA supplement; they do not establish separate occupancy by the SREBP-1 and SREBP-2 protein isoforms. Classic experiments support cooperating Sp1 sites flanking the SRE.
Astra identifies the canonical SRE and predicts losses for all five selected substitutions within it. It also recognizes the flanking C/T-rich sequences and proposes cooperation. But it misses FP1 and substantially underestimates losses in the cooperating Sp1-associated elements:
| LDLR element and example | Explanation prediction | Measured log2 effect | Interpretation |
|---|---|---|---|
| FP1: V07, G81A | 0.00 | −3.784 | Misses the most damaging allele in the panel, inside an experimentally footprinted element. |
| SRE: V28, A164C | −1.65 | −2.798 | Recognizes disruption of the canonical sterol-response element and the negative direction. |
| SP1 / repeat 3: V34, C177T | +0.15 | −3.090 | Proposes an ETS-site gain at an allele already shown to impair Sp1 binding. |
For FP1, all six sampled variants reduce activity; the mean measured effect is −2.08, versus Astra's −0.05. For V34, the known c.-142C>T allele, earlier experiments directly observed impaired Sp1 binding and reduced reporter activity. Creating a short ETS-like core does not establish compensation for losing a cooperating activator. GPN-Star's dependencies are model-derived and its MPRA track reuses the Kircher measurements; we use it as a reference for examining architecture, not as an independent experiment or a quantitative comparison with Astra.
The provider-exposed summary also names the LDL receptor promoter, so the sequence-focused instruction does not establish that recognition or recall was absent. This expanded element audit was performed after reading the responses; it leaves the original selection and all 50 scored alleles unchanged.
| Panel | Baseline Spearman | Explanation Spearman | Baseline Pearson | Explanation Pearson |
|---|---|---|---|---|
| MSH6 | 0.800 | 0.803 | 0.740 | 0.714 |
| LDLR | 0.473 | 0.499 | 0.608 | 0.451 |
Each score uses all 50 variants. One completion per condition does not establish a benefit from requesting explanations: ordering improved slightly in both cases, while Pearson correlation decreased. The detailed responses are useful for locating unsupported assumptions and gaps in the task definition. These supplementary predictions remain separate from the baseline leaderboard.
The case-study analysis maps the literature to the exact sequence, compares all four LDLR elements, and plots every allele against both sets of predictions. The complete prompts and responses are readable and downloadable, with committed data for offline replay.
Conclusion
VEP-bench shows that general-purpose language models can recover part of the ordering of measured variant effects from sequence and experimental context. Astra max leads the selected configurations on all three tasks; the rankings below it vary by task, and performance also varies across variant classes. These differences make the task and subset results useful alongside the overall ranking.
The specialist comparisons and broader analyses help put these results in context, but the limited set of models and assay panels leaves substantial uncertainty. This release provides a public starting point for evaluating progress across fitness, expression, and splicing.